ChainThink
Stay ahead, master crypto insights
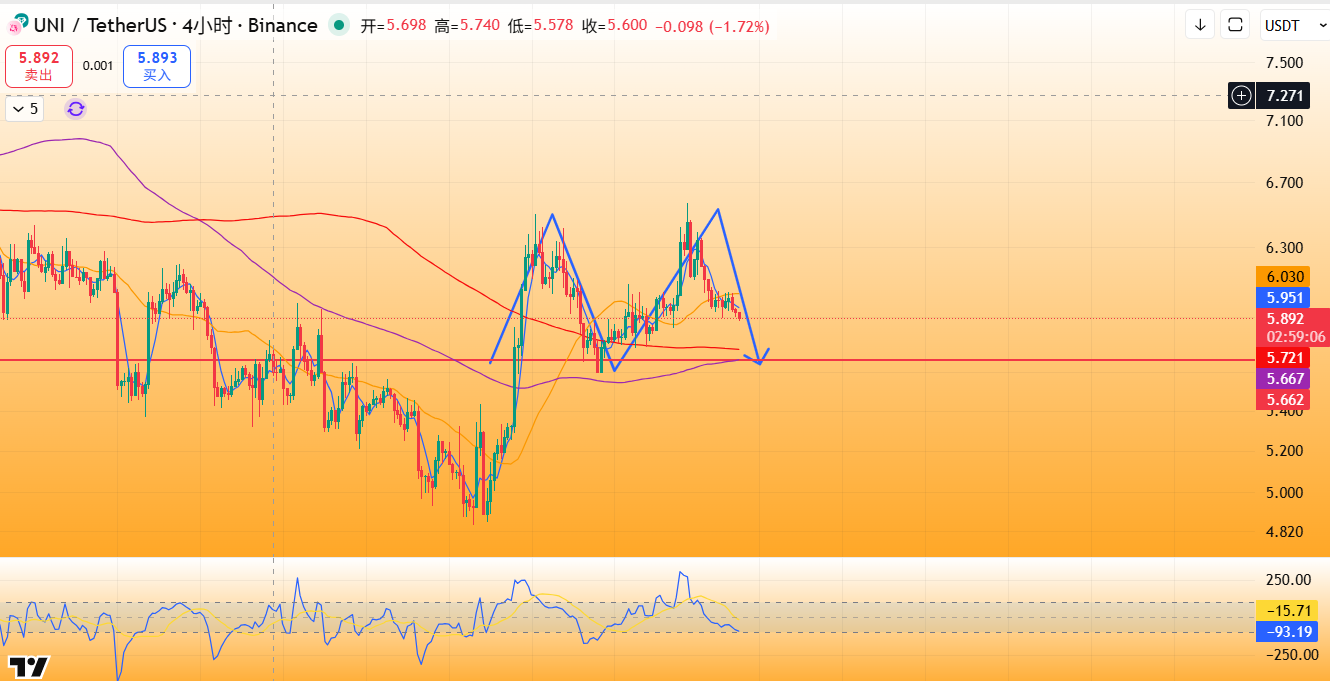
UNI Short Signal (Short-term): Potential Double Top Rejection + Breakout Below Bollinger Band Middle Band, Support at ~$5.7, Resistance at $6.1
UNI Short Signal (Short-term): Potential Double Top Rejection + Breakout Below Bollinger Band Middle Band, Support at ~$5.7, Resistance at $6.1
2025-12-31 09:01
ChainThink report: On December 31, AI-driven technical analysis indicated that UNI could potentially challenge a high of $6.4 upon the December 26 signal, which was subsequently achieved as expected. However, currently, a potential double top pattern is forming on the daily chart, with $6.4 becoming a critical medium-term resistance level. On the intraday timeframe, the 4-hour chart has broken below the Bollinger Band middle band, and CCI is approaching a breach below -100, signaling strengthening bearish momentum. In the short term, $6.1 represents a key confluence zone combining MA60 and a structural reversal resistance; failure to break above it may lead to a decline toward the neckline of the double bottom at $5.7.
If the 4-hour chart sustains two consecutive candles above $6.1, the short-term bearish signal will be invalidated. (AI analysis, not investment advice, valid for 1-3 days)
Disclaimer: Contains third-party opinions, does not constitute financial advice


Alpha Research
Alpha New Token Research Report, Binance Alpha Operation Suggestions
Popular Airdrop Tutorial
Selected potential airdrop opportunities to gain big with small investments
Crypto-linked Stocks
Crypto-stock linkage, real-time market quotes and in-depth analysis
Market Analysis
BTC/ETH, Major Cryptocurrencies, and Hot Altcoins Price Trends
Regulatory Watch
American Crypto Act – timely interpretations of policies worldwide
Frontier Insights
Spotlight on Frontier, trending projects, and breaking events
Crypto Weekly
Tracking on-chain movements of the smart money and institutions
ChainThink App
WeChat Official Account
WeChat Customer Service