ChainThink
Stay ahead, master crypto insights
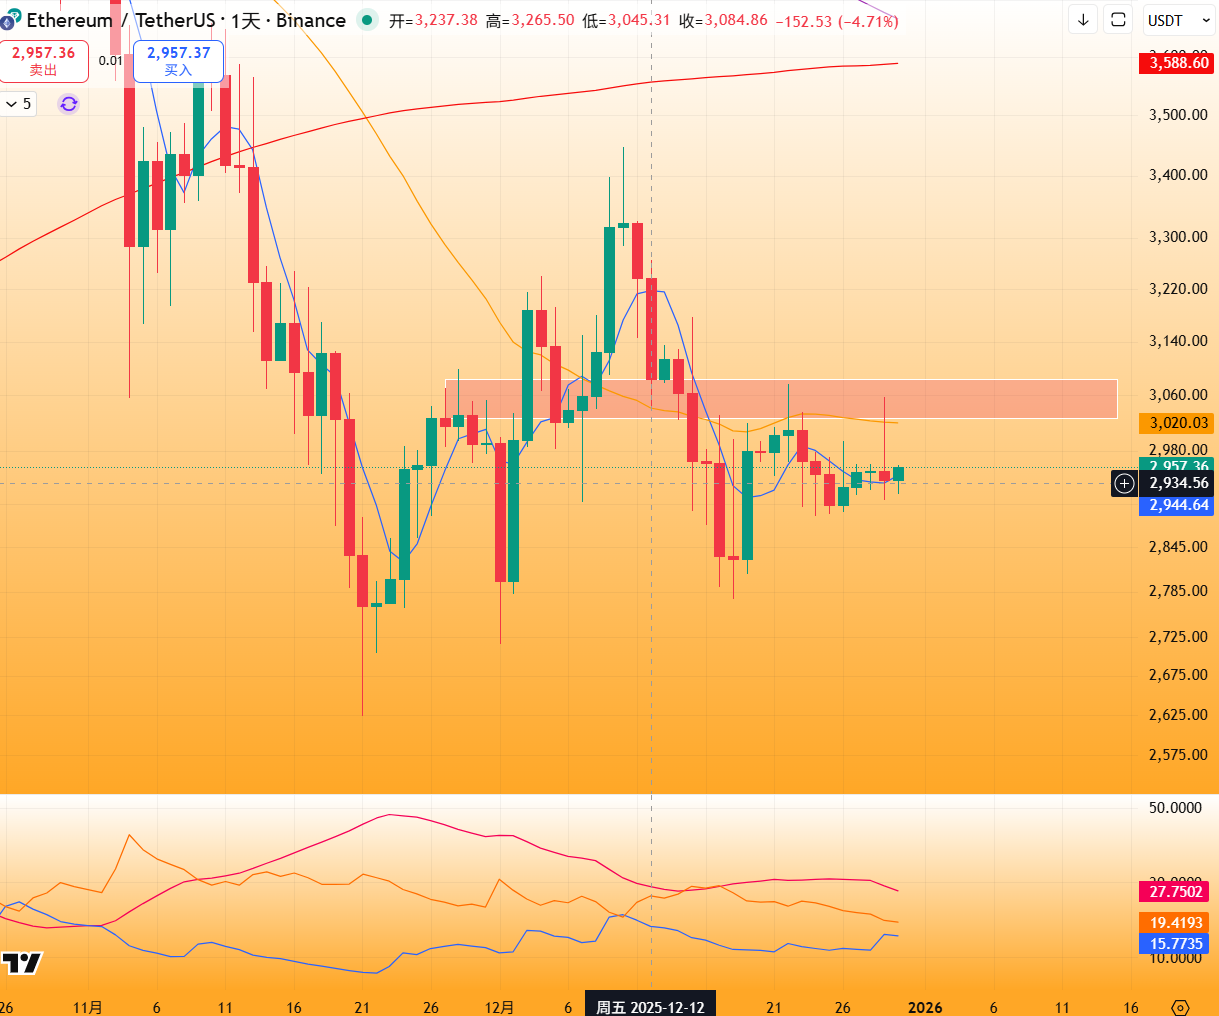
ETH Volatility Signal (Short-term): ADX declining below 25 + Volume-confirmed Inverted Hammer candlestick bearish pattern, Support at ~$2,860, Resistance at $3,050
ETH Volatility Signal (Short-term): ADX declining below 25 + Volume-confirmed Inverted Hammer candlestick bearish pattern, Support at ~$2,860, Resistance at $3,050
2025-12-30 12:30
ChainThink report: On December 30, AI-powered technical analysis shows ETH has broken below the key bullish support level of $2,950 mentioned yesterday. The price has now resumed a ranging movement, closing on a high-volume inverted hammer candlestick on the daily chart, indicating bearish sentiment. However, the $2,860–$2,920 zone has held firm for over ten days, and the ADX indicator is retreating below 25, signaling a potential shift toward neutrality—suggesting further range-bound consolidation may persist.
Key resistance at $3,050 POC and liquidity gravity zone; a valid breakout requires sustained close above these levels for two consecutive daily candles, breaking the range and shifting momentum to bullish. Key support at $2,860, the lower edge of the triangle pattern—invalidation via break below this level would signal the end of the range and a bearish reversal. (AI analysis, not investment advice, validity period: 2–5 days)
Disclaimer: Contains third-party opinions, does not constitute financial advice


Alpha Research
Alpha New Token Research Report, Binance Alpha Operation Suggestions
Popular Airdrop Tutorial
Selected potential airdrop opportunities to gain big with small investments
Crypto-linked Stocks
Crypto-stock linkage, real-time market quotes and in-depth analysis
Market Analysis
BTC/ETH, Major Cryptocurrencies, and Hot Altcoins Price Trends
Regulatory Watch
American Crypto Act – timely interpretations of policies worldwide
Frontier Insights
Spotlight on Frontier, trending projects, and breaking events
Crypto Weekly
Tracking on-chain movements of the smart money and institutions
ChainThink App
WeChat Official Account
WeChat Customer Service