ChainThink
Stay ahead, master crypto insights
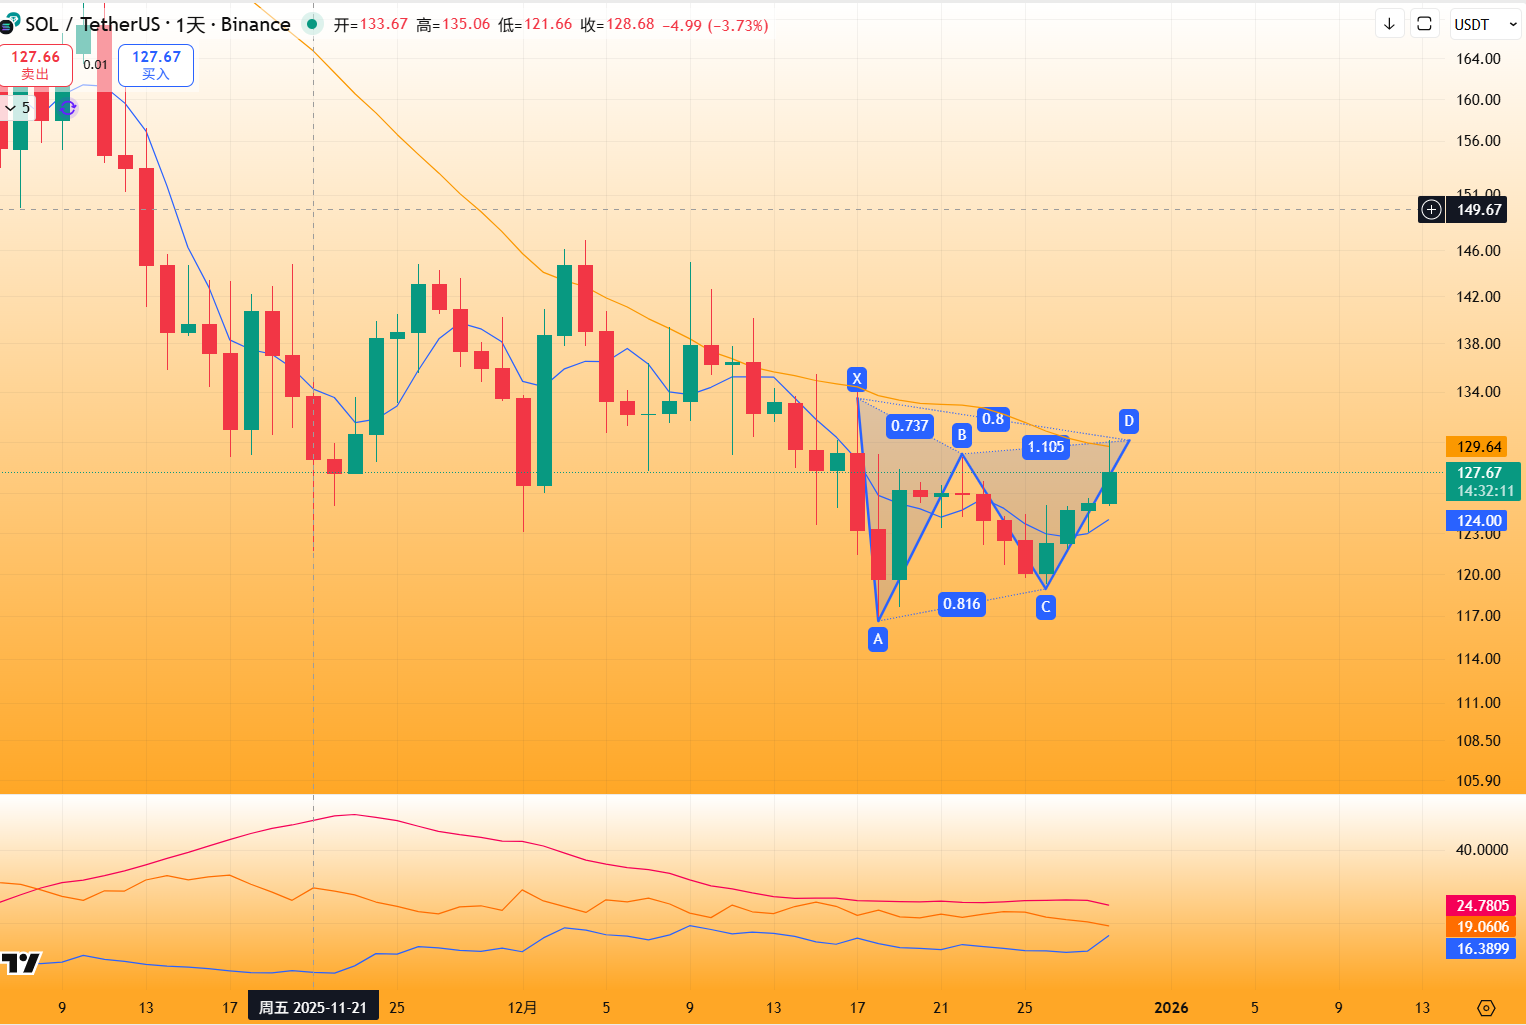
SOL Exclusive Market Outlook (Short-term): Harmonic Butterfly Bullish Pattern with 0.8 PRZ + WR Rapid Uptrend, Support around $125, Resistance at $130
SOL Exclusive Market Outlook (Short-term): Harmonic Butterfly Bullish Pattern with 0.8 PRZ + WR Rapid Uptrend, Support around $125, Resistance at $130
2025-12-29 17:32
ChainThink report: On December 29, AI-driven technical analysis indicates that SOL generated a bullish signal on December 25. The price has recently surged to around $130, approaching the resistance level near 0.8 of the harmonic butterfly bullish pattern, which coincides with a POC (Point of Control) cluster zone—indicating significant supply pressure. However, on the daily chart, the WR (Williams %R) indicator is rapidly rising and has broken through key levels, while the DNI (Directional Momentum Index) +DI line is trending upward toward potential crossover. As long as the critical support at $125 is not breached, the bullish signal remains intact, potentially allowing further upward movement toward the central region of the $136 consolidation range.
If the close below $125 on the daily chart confirms a breakdown, the bullish signal will be invalidated, triggering a potential retest of the lower boundary of the previously tested triangle support structure. (AI analysis only; not investment advice; validity period: 1–5 days)
Disclaimer: Contains third-party opinions, does not constitute financial advice


Alpha Research
Alpha New Token Research Report, Binance Alpha Operation Suggestions
Popular Airdrop Tutorial
Selected potential airdrop opportunities to gain big with small investments
Crypto-linked Stocks
Crypto-stock linkage, real-time market quotes and in-depth analysis
Market Analysis
BTC/ETH, Major Cryptocurrencies, and Hot Altcoins Price Trends
Regulatory Watch
American Crypto Act – timely interpretations of policies worldwide
Frontier Insights
Spotlight on Frontier, trending projects, and breaking events
Crypto Weekly
Tracking on-chain movements of the smart money and institutions
ChainThink App
WeChat Official Account
WeChat Customer Service