ChainThink
Stay ahead, master crypto insights
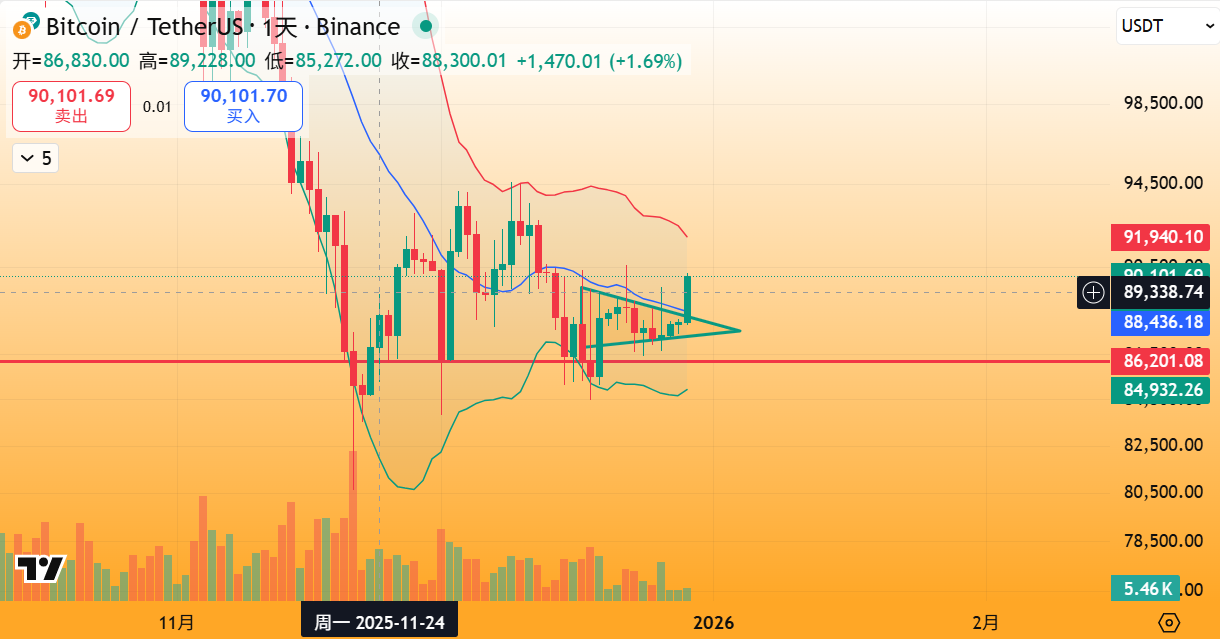
BTC Bullish Signal (Short-term): Bollinger Middle Band Crossover + Secondary Double Bottom Neckline Resistance Break, Key Support at ~$88,500, Resistance at $93,000
BTC Bullish Signal (Short-term): Bollinger Middle Band Crossover + Secondary Double Bottom Neckline Resistance Break, Key Support at ~$88,500, Resistance at $93,000
2025-12-29 12:34
ChainThink report: On December 29, AI-driven technical analysis indicates that BTC generated a bullish signal on December 25. The price has now surged into the first resistance zone—89,500–90,500—marking the neckline resistance of the double bottom pattern and a confluence of multiple supply zones. However, the current intraday large bullish candle has pierced above the Bollinger Band middle band, which had remained unbroken for nearly half a month, signaling bullish momentum. OBV has turned upward, volume has resumed strength, yet BTC must not re-break below the critical support near $88,500. This level serves as both the Bollinger Band middle band support and the breakout point of the ascending triangle's upper trendline. A daily close below this level would invalidate short-term bullish signals, triggering a return to consolidation and potentially testing the $86,000 support again.
If the price maintains its defense, it may target the upper boundary of the VPVR value area at VAL $93,000. (AI analysis, not investment advice, valid for 1–5 days)
Disclaimer: Contains third-party opinions, does not constitute financial advice


Alpha Research
Alpha New Token Research Report, Binance Alpha Operation Suggestions
Popular Airdrop Tutorial
Selected potential airdrop opportunities to gain big with small investments
Crypto-linked Stocks
Crypto-stock linkage, real-time market quotes and in-depth analysis
Market Analysis
BTC/ETH, Major Cryptocurrencies, and Hot Altcoins Price Trends
Regulatory Watch
American Crypto Act – timely interpretations of policies worldwide
Frontier Insights
Spotlight on Frontier, trending projects, and breaking events
Crypto Weekly
Tracking on-chain movements of the smart money and institutions
ChainThink App
WeChat Official Account
WeChat Customer Service