ChainThink
Stay ahead, master crypto insights
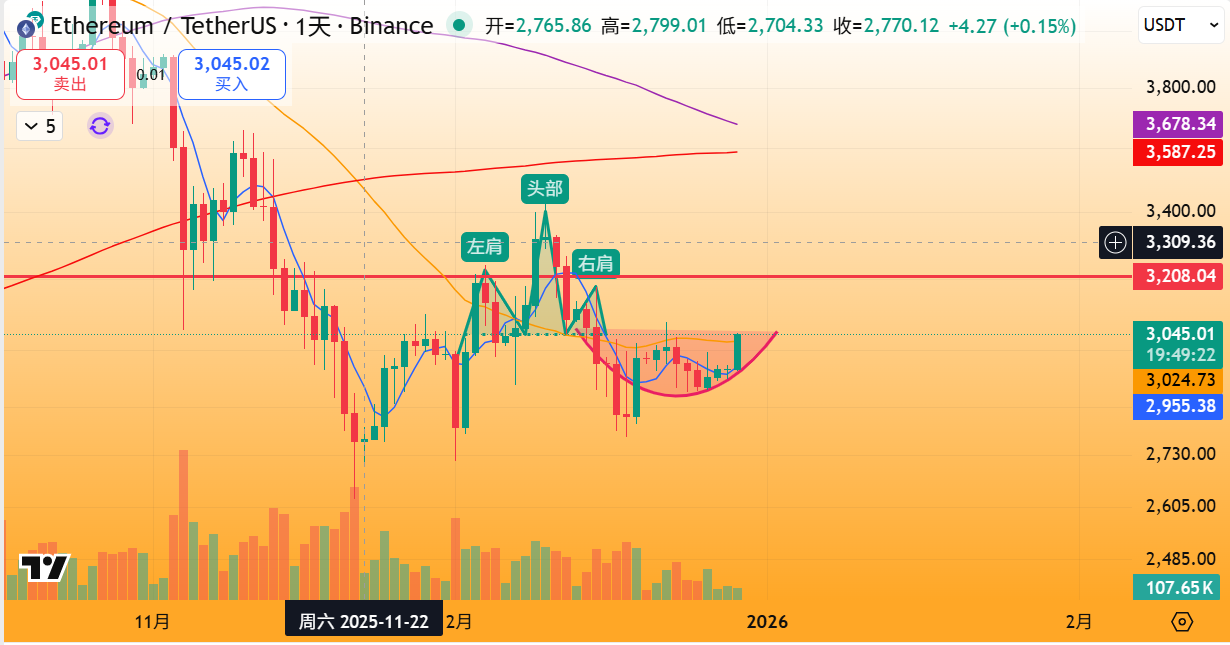
ETH Exclusive Technical Analysis (Short-term): Potential breakout above the neckline of the cup-and-handle pattern + completion of impulse wave 3, support around $2,950, resistance at $3,180
ETH Exclusive Technical Analysis (Short-term): Potential breakout above the neckline of the cup-and-handle pattern + completion of impulse wave 3, support around $2,950, resistance at $3,180
2025-12-29 12:11
ChainThink report: On December 29, AI-powered technical analysis indicates that ETH generated a bullish signal on December 25. The price has now surged into the first resistance zone. The 3030–3080 area represents a dual neckline region combining a rounded bottom and a head-and-shoulders top pattern. Previously acting as support, this level has now transformed into resistance. However, MFI has completed its breakout with strong capital inflows, and MACD has reformed a golden cross with an upward turn. If key support at $2950 can be maintained, there remains potential to complete a daily-level impulse wave three structure, targeting above VAL3180, the upper boundary of the VPVR value zone.
Should $2960 be broken decisively, the bullish signal becomes invalid, confirmed by daily close (AI analysis, not investment advice; validity period: 1–5 days).
Disclaimer: Contains third-party opinions, does not constitute financial advice


Alpha Research
Alpha New Token Research Report, Binance Alpha Operation Suggestions
Popular Airdrop Tutorial
Selected potential airdrop opportunities to gain big with small investments
Crypto-linked Stocks
Crypto-stock linkage, real-time market quotes and in-depth analysis
Market Analysis
BTC/ETH, Major Cryptocurrencies, and Hot Altcoins Price Trends
Regulatory Watch
American Crypto Act – timely interpretations of policies worldwide
Frontier Insights
Spotlight on Frontier, trending projects, and breaking events
Crypto Weekly
Tracking on-chain movements of the smart money and institutions
ChainThink App
WeChat Official Account
WeChat Customer Service