ChainThink
Stay ahead, master crypto insights
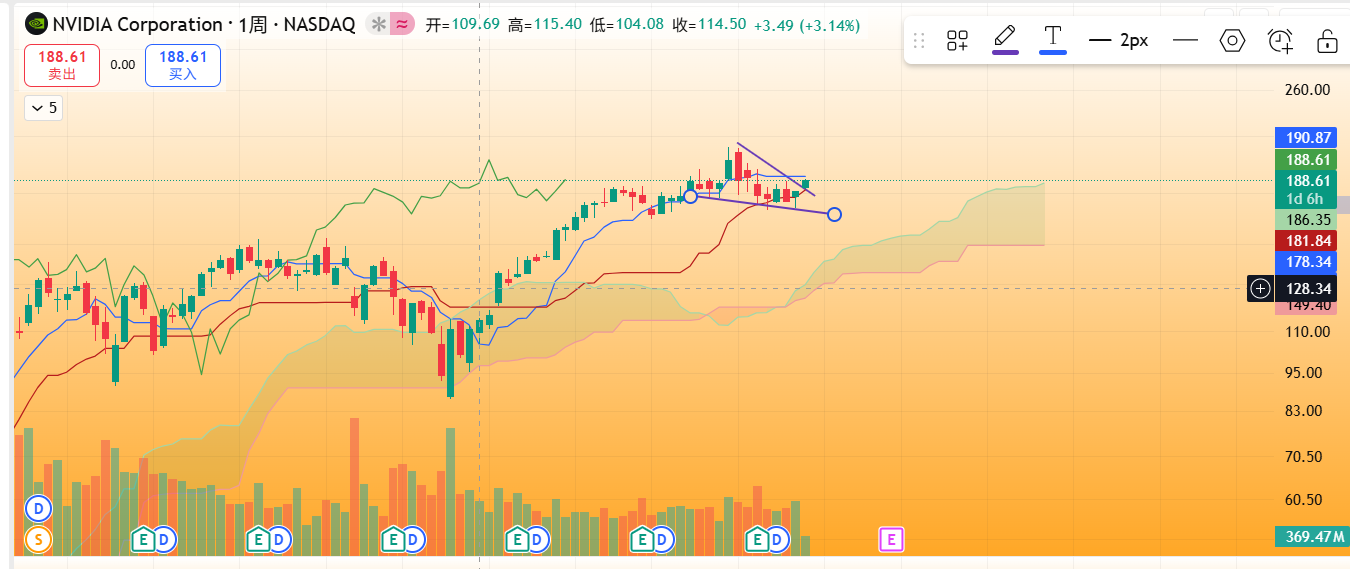
NVDA US Stock Signal (Short-term): Kumo Cloud Conversion Line Resistance + Wedge Consolidation Breakout, Support near $180, Resistance at $191
NVDA US Stock Signal (Short-term): Kumo Cloud Conversion Line Resistance + Wedge Consolidation Breakout, Support near $180, Resistance at $191
2025-12-25 23:18
ChainThink report: On December 25, AI-powered technical analysis indicates that after NVDA (Nvidia) U.S. stocks reached a bottom at $170 on December 18, they have rebounded to date. In the short term, near-term resistance lies at the weekly Ichimoku Kinko Hyo conversion line and daily cloud resistance, with strong resistance at $191. A positive sign is that the daily chart has already broken above the upper boundary of the wedge consolidation pattern with increased volume, and MFI has also crossed upward. If the price retests $180 without breaking below it, the overall trend remains bullish; however, a break below $180 could trigger a test of the potential neckline at $168, corresponding to a head-and-shoulders top pattern.
If $180 remains unbroken, then after surpassing $191, the next target is $200. (AI analysis, not investment advice, validity period 2–8 days)
Disclaimer: Contains third-party opinions, does not constitute financial advice


Alpha Research
Alpha New Token Research Report, Binance Alpha Operation Suggestions
Popular Airdrop Tutorial
Selected potential airdrop opportunities to gain big with small investments
Crypto-linked Stocks
Crypto-stock linkage, real-time market quotes and in-depth analysis
Market Analysis
BTC/ETH, Major Cryptocurrencies, and Hot Altcoins Price Trends
Regulatory Watch
American Crypto Act – timely interpretations of policies worldwide
Frontier Insights
Spotlight on Frontier, trending projects, and breaking events
Crypto Weekly
Tracking on-chain movements of the smart money and institutions
ChainThink App
WeChat Official Account
WeChat Customer Service