Market Overview 9.17: The First Rate Cut of the Year Has Arrived, Is It a Positive Outcome or the Start of a New Bull Market?
2025-09-17 18:10
The Federal Reserve will hold its monetary policy meeting tomorrow at 2 AM, followed by a speech from Powell. This meeting is highly anticipated because, since the rate cut in December last year, there have been no further rate cuts to date, making this the first rate cut of the year. Although there has been no rate cut this year, the stock market and cryptocurrency have continued to set new highs, with the market already having some expectations for a rate cut. Therefore, after this first rate cut, will it be a positive outcome or the start of a new bull market?
Focus Points of the Monetary Policy Meeting
According to the Fed's watch tool, the probability of a rate cut is 100%, but it is still uncertain whether it will be a 25-basis-point cut or a 50-basis-point cut.
The probability of a 25-basis-point cut is 96%, while the probability of a 50-basis-point cut is 4%;
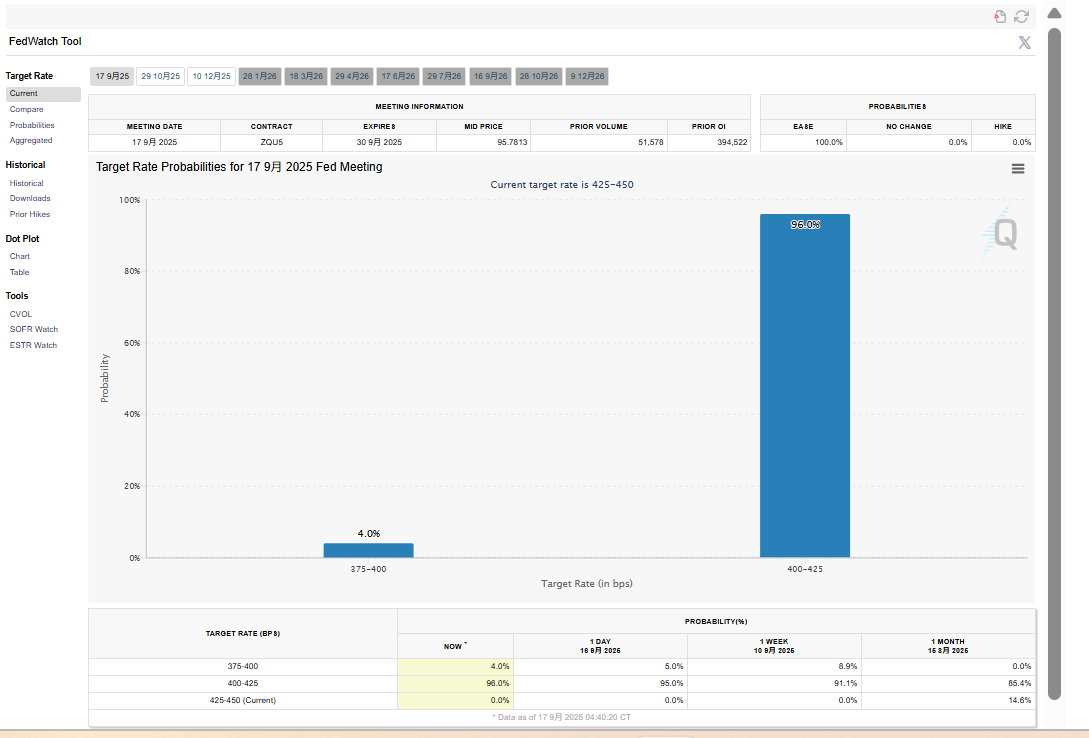
Powell's speech and the "dot plot" of the Fed officials' interest rate projections are the key focus points of this decision.
Dot Plot: The median interest rate for 2025 is expected to be lowered to 4.125%, indicating a more dovish policy stance. However, the median interest rate for 2026 is likely to remain at 3.375%, with some officials possibly raising it to 3.625%, reflecting concerns about persistent inflation.
Powell's Speech: Powell's attitude towards the "rate cut pace" is the biggest point of interest. If he takes an hawkish stance, emphasizing concerns about inflation, the market will reduce expectations for future Fed rate cuts, putting pressure on the stock market. If he takes a more dovish stance than expected, the market will quickly price in an aggressive rate cut cycle, causing the US dollar index to plummet.
Additionally, Stephen Miran, Trump's economic advisor, may be confirmed as a Fed board member this week and participate in decision-making.
BTC Price Analysis
Volume and Price Analysis: The key volume performance to watch for BTC is on August 22nd and the past week, which shows the intention of the major players. On August 22nd, there was a sudden surge in volume leading to a sharp increase, but it was blocked at 117500, after which it continued to decline. This can be understood as a typical buying climax and a dealer's hedging shorting behavior. Therefore, 117500 has always been a key resistance level.
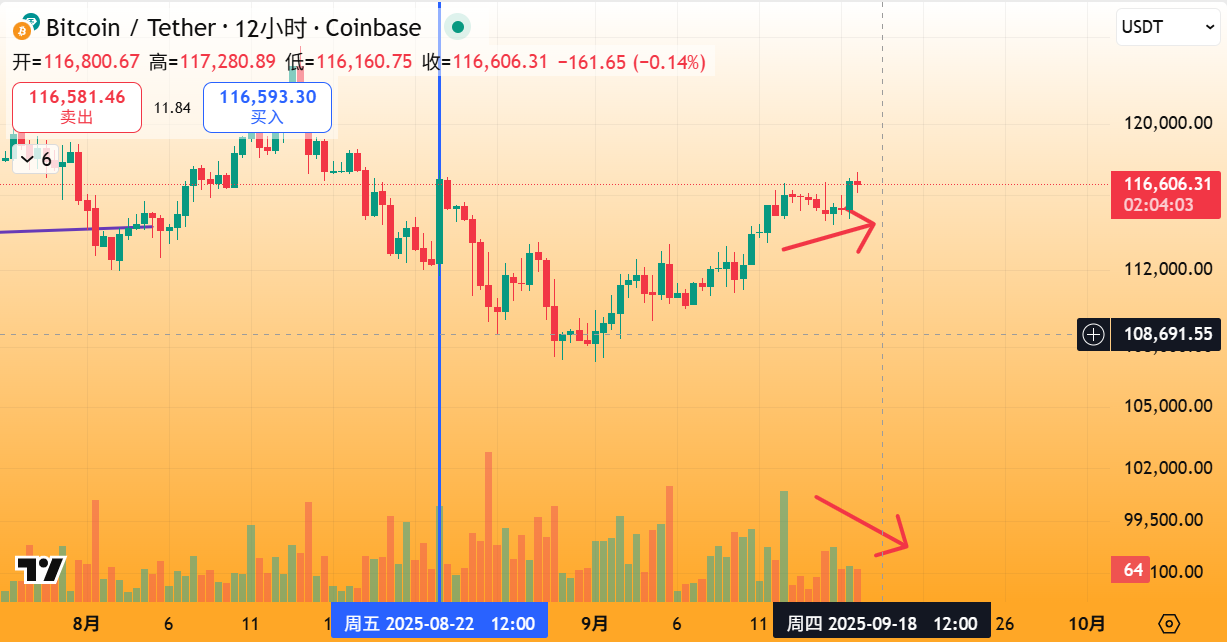
Recently, on September 12th, there was a surge in volume, but it still failed to break through. Although the price has risen recently, the volume has not kept up, signaling a potential risk. If the volume does not keep up with the subsequent price rise, it could lead to a false breakout. The key resistance levels above are 119000-120000.
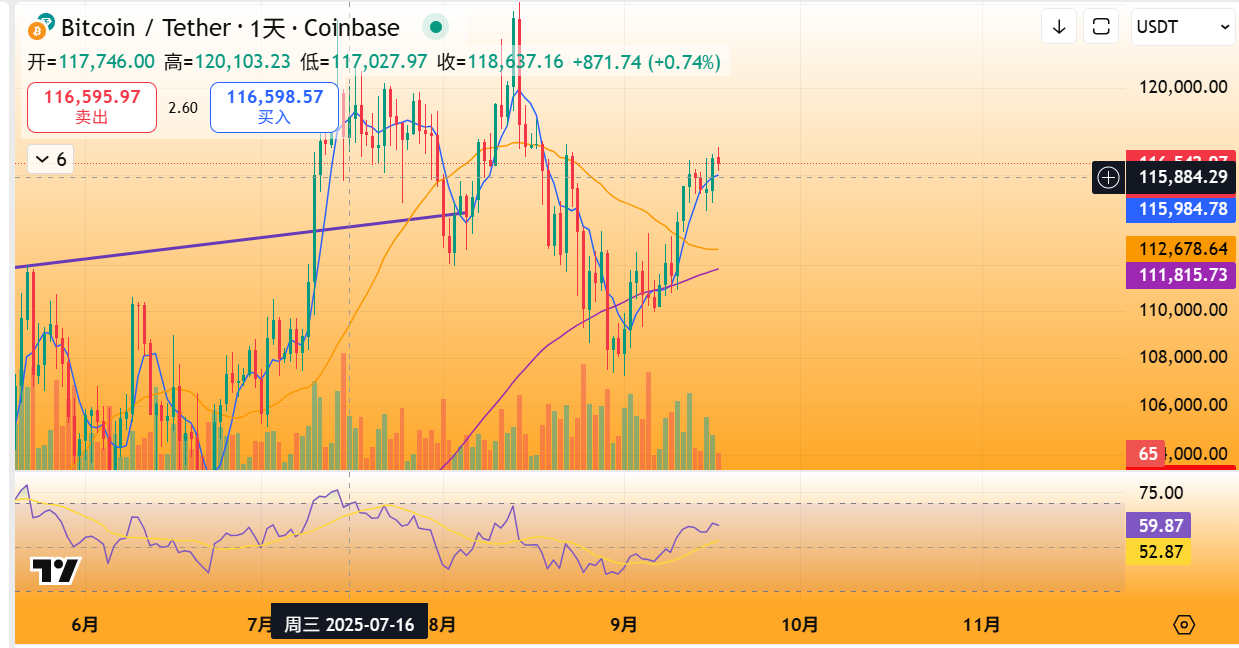
Indicator Convergence: The moving averages and RSI show a slightly bullish trend. Key support levels to watch are between 115000-116000; a break below this would break the bullish momentum;
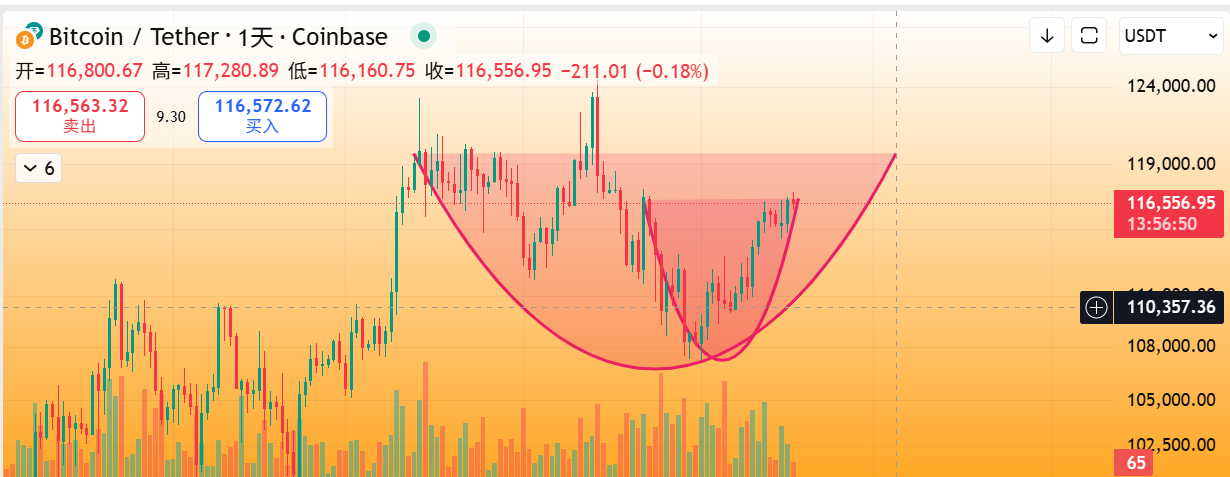
Pattern Preview: The current rebound in BTC has formed a tower bottom structure, currently constrained near the neckline at 117500. If it strongly holds above this level, it will face a higher-level tower bottom neckline at 119000-12000. If it continues to fail to break through, the price may test the support level of 113000-115000, forming a large-scale consolidation and washing phase, until one day the support or resistance is broken.
Author: Aaron, ChainThink
Disclaimer: Contains third-party opinions, does not constitute financial advice


Alpha Research
Alpha New Token Research Report, Binance Alpha Operation Suggestions
Popular Airdrop Tutorial
Selected potential airdrop opportunities to gain big with small investments
Crypto-linked Stocks
Crypto-stock linkage, real-time market quotes and in-depth analysis
Market Analysis
BTC/ETH, Major Cryptocurrencies, and Hot Altcoins Price Trends
Regulatory Watch
American Crypto Act – timely interpretations of policies worldwide
Frontier Insights
Spotlight on Frontier, trending projects, and breaking events
Crypto Weekly
Tracking on-chain movements of the smart money and institutions

ChainThink App

WeChat Official Account

WeChat Customer Service