ChainThink
Stay ahead, master crypto insights
Rethinking After the Surge: Which Stage of the Macro Cycle Are We In?
Rethinking After the Surge: Which Stage of the Macro Cycle Are We In?

2025-07-14 08:53
Editor's Note: With BTC once again setting a new historical high, ETH strongly breaking through the $3,000 threshold, the market is showing a clear trend of accelerating upward. Looking at the analysis of the reasons for the market's rise, the topic of interest rate cuts always comes up. This morning, two senior Federal Reserve officials once again gave positive signals regarding the expectation of rate cuts.
- San Francisco Fed President Daly said last night: "I think there may be two rate cuts, but everyone's expectations are uncertain, and considering implementing rate cuts in the autumn."
- Federal Reserve Governor and potential next Chairperson Waller stated that even with strong employment data in June, the Fed should consider cutting rates at the July meeting — "I have made my position clear. The current policy rate level is too high, we can discuss lowering the benchmark rate in July... When inflation declines, we do not need to maintain such a tight monetary policy stance, which is the proper decision-making logic for central banks."
However, what does interest rate cuts really mean for the cryptocurrency market? What other measures have similar effects? Which stage of the liquidity cycle are we currently in? What signals can be observed to predict future changes? Many market participants lack a clear understanding of these most fundamental yet important questions. In the following, long-term macro-focused cryptocurrency trader hoeem provides his answers to these questions.The following is the content of hoeem's article.
Which stage of the liquidity cycle are we in? Generational wealth is often created during the transition from tight to loose. Accurately grasping the position of the liquidity cycle is crucial for investment layout — so where exactly are we now? Let me tell you the answer. Even if you hate macro analysis, you should pay attention to changes in the liquidity cycle, because central bank liquidity is the lubricant of the global economic engine.Adding too much leads to overheating; withdrawing too aggressively causes the piston to seize, and your good life will follow shortly after. If you can accurately track the flow of liquidity, you can prepare for bubbles and crashes in advance.2021-2025, four stages of the liquidity cycle First stage: massive liquidity injection
- Time period: 2020 - 2021;
- Fire hydrants fully open: zero interest rates + unprecedented quantitative easing (QE) + $1.6 trillion fiscal stimulus;
- Global money supply (M2) growth reached a post-war high.
Second stage: massive liquidity withdrawal
- Time period: 2021 - 2022;
- 500 basis point aggressive rate hikes + quantitative tightening (QT) + expiration of crisis response policies;
- The bond market had its worst performance in history in 2022 (a drop of about 17%).
Third stage: moderate period
- Time period: 2022 - 2024;
- Policies remain tight, but no further tightening;
- Central banks are allowing existing policies to take effect to suppress inflation.
Fourth stage: initial shift
- Time period: 2024 - 2025;
- Global interest rate cuts begin, restrictions gradually ease, although interest rates remain relatively high, they have started to decline globally.
In 2025, where are we located? Standing in the middle of 2025, one foot is still in the moderate period, but the other has begun to tentatively shift. The current stage still shows a combination of "high interest rates + continued quantitative tightening", but the policy balance has clearly shifted towards easing, unless a new shock pulls us back into the "massive liquidity injection" mode. More details can be found in the following "traffic light quick reference table" — I used ChatGPT to organize this content into a more intuitive table, which can help you better see the liquidity comparison between 2017, 2021, and 2025.
Note: In the following chart, “🔴” indicates not activated, “🟠” indicates lightly activated, and “🟢” indicates strongly activated. Additionally, it should be noted that the last item of leverage will control the other 11 items of leverage.
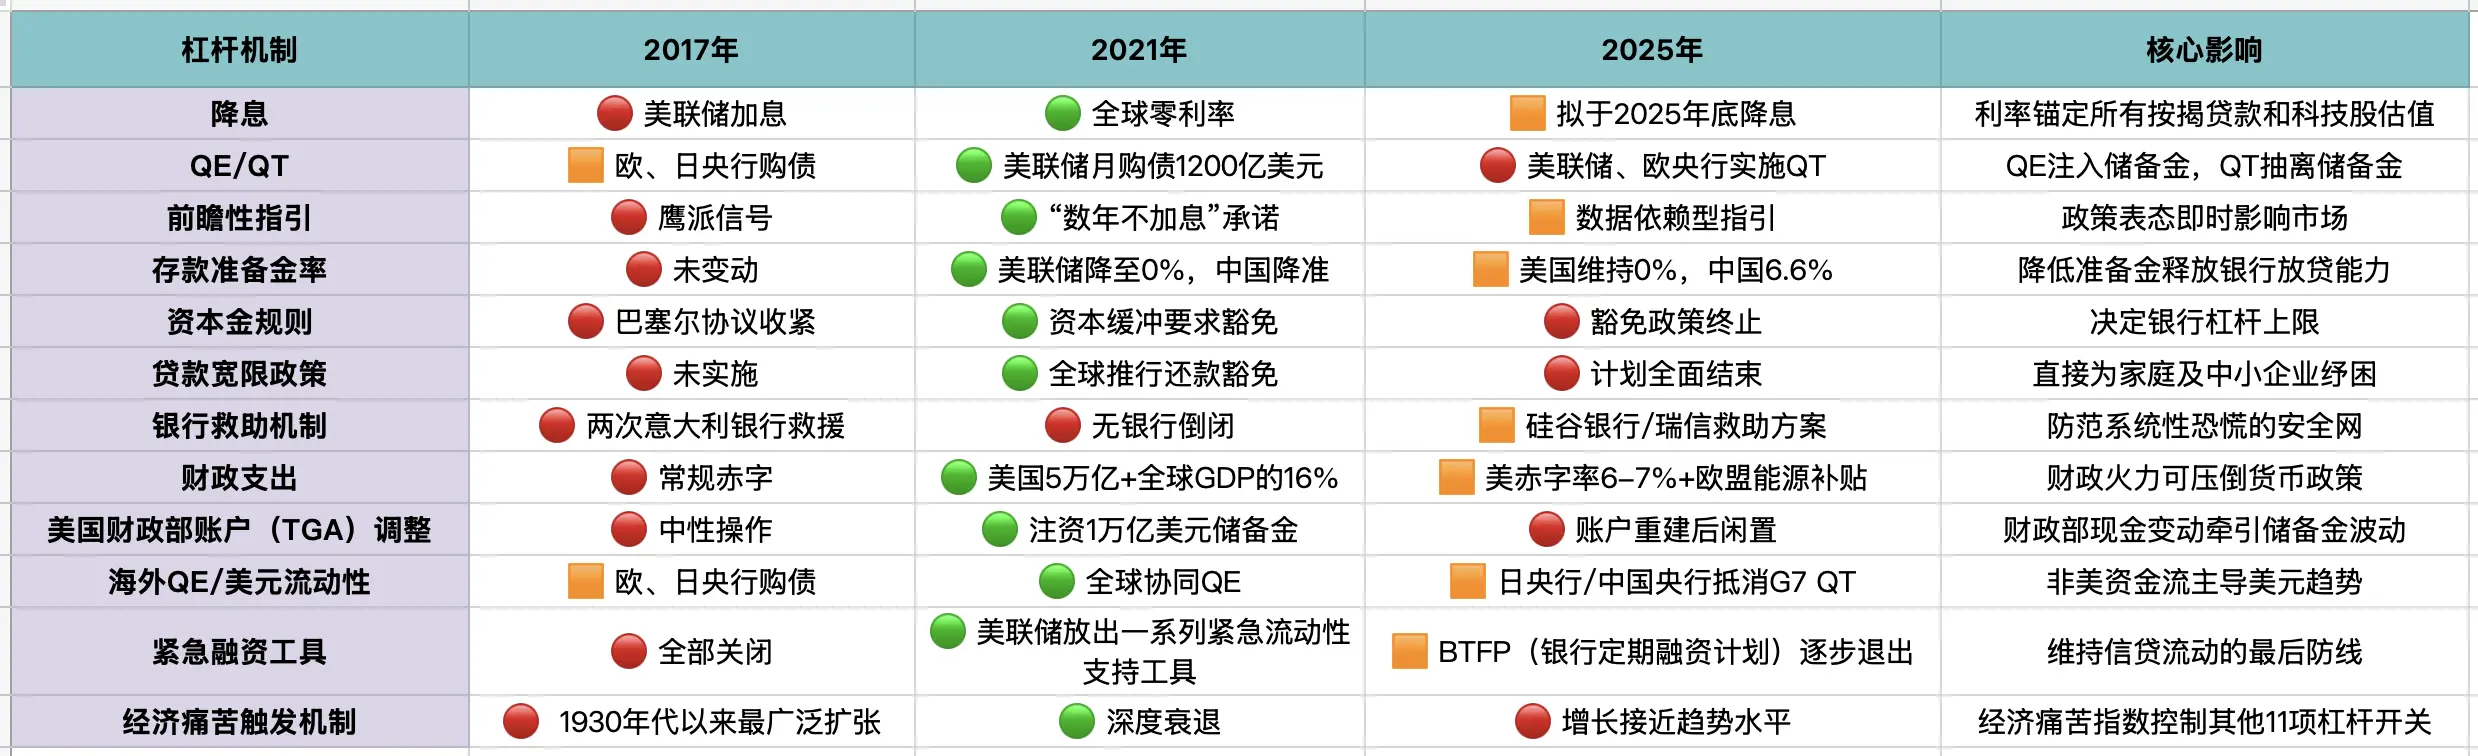
Leverage mechanism detailed analysis on interest rate cuts
- 2017: The Fed led rate hikes, global easing was limited;
- 2021: A global emergency rate cut wave swept through, interest rates approached the lower bound;
- 2025: To maintain anti-inflation credibility, high interest rates are maintained, and the US and EU plan to start a mild rate cut by the end of 2025.
Quantitative Easing/Tightening (QE/QT)
- 2017: The Fed reduced its balance sheet, while the ECB and BOJ continued to purchase bonds;
- 2020-2021: Global QE scale broke historical records;
- 2025: Policy stance reversed — the Fed maintains QT, the BOJ purchases unlimited bonds, and China implements targeted liquidity injections.
The essence of the liquidity cycle is that QE is blood transfusion into the vessels, while QT is slow blood withdrawal, therefore it is essential to recognize the timing of switching between QT/QE and the positioning of the liquidity cycle. Policy status in mid-2025
Rate cut process:Policy rates remain high, if Powell's proposal is implemented, the first rate cut may start in the fourth quarter of 2025.QE/QT dynamics:QT continues to run, no new QE plans are in place, but early signals of stimulus policies have emerged.
Four observation signals Signal one: Inflation = 2%, and the policy announces a risk balance
- Focus: The Fed/European Central Bank statement shifts to neutral language;
- Significance: Clearing the last rhetorical obstacle before rate cuts.
Signal two: QT pause (100% reinvestment of maturing bonds)
- Focus: FOMC/European Central Bank announces full reinvestment;
- Significance: Stop drawing blood, shift to neutral reserves.
Signal three: FRA-OIS spread greater than 25 basis points, or repo rates surge
- Focus: Three-month FRA-OIS or GC repo transactions jump to over 20 basis points;
- Significance: Indicates pressure on USD funding, often forcing liquidity intervention.
Signal four: PBOC fully cuts reserve requirement ratio by 25 basis points
- Focus: Deposit reserve ratio drops below 6.35%;
- Significance: Releases 400 billion base money, often the first domino in emerging market easing.
Simplified overview In short, all these complex data boil down to the fact that we have not yet entered the next phase of "massive liquidity injection". Therefore, market risk appetite will continue to fluctuate, and there will be no real euphoria unless multiple leverage mechanisms turn green.
Disclaimer: Contains third-party opinions, does not constitute financial advice


OpenClaw Practical Guide
This column focuses on the real progress of Agents: technological evolution, application implementat
Crypto Weekly
Tracking on-chain movements of the smart money and institutions
Frontier Insights
Spotlight on Frontier, trending projects, and breaking events
Blowup Alert
As the 2026 crypto bear market deepens, exit scams and project blowups are becoming increasingly fre
Regulatory Watch
American Crypto Act – timely interpretations of policies worldwide
Popular Airdrop Tutorial
Selected potential airdrop opportunities to gain big with small investments
FusnChain
FusnChain